Contour Maps
Advertisement
3DFieldPro v.2.9.2
Create contour maps. 3DField is a contouring surface plotting and 3D data software that runs under Microsoft Windows NT/XP/Vista/7. 3DField converts your data into contour maps and surface plots.
Advertisement
Uniplot PlotClient v.4.0
UniPlot was developed to visualize and analyze test data. With only a few mouse clicks, you can transform your data into 3D surface maps with color zones, contour maps with color fill, or plot 2D data into diagrams with several axes.

RTOPO v.3.3
Simple, powerful and inexpensive CAD software for surveying. You can do triangulation, isolines, color-filled contour maps, sections, intersections, volume and editing XYZ files. You can process hundreds of thousands of points or triangles.

TRIANGULATION for AutoCAD v.2.1
An add-on for AUTOCAD, for the TRIANGULATION of a set of point, isolines, KML creator, the VOLUME of a set of 3dface entities, loading of XYZ points files and sections.

Topography in AutoCAD v.2.3
An add-on for AUTOCAD or BricsCAD, for the TRIANGULATION of a set of point, isolines, KML 2D and 3D creator, the VOLUME of a set of 3dface entities, loading of XYZ points files, surface flatness and sections.
WinFence v.2 21
WinFence can be used to graphically create detailed, full-color, cross-sections and fence diagrams quickly and easily. The program can be used to interpret and map soil and rock layers, contamination, fossils, minerals and hydrocarbons.
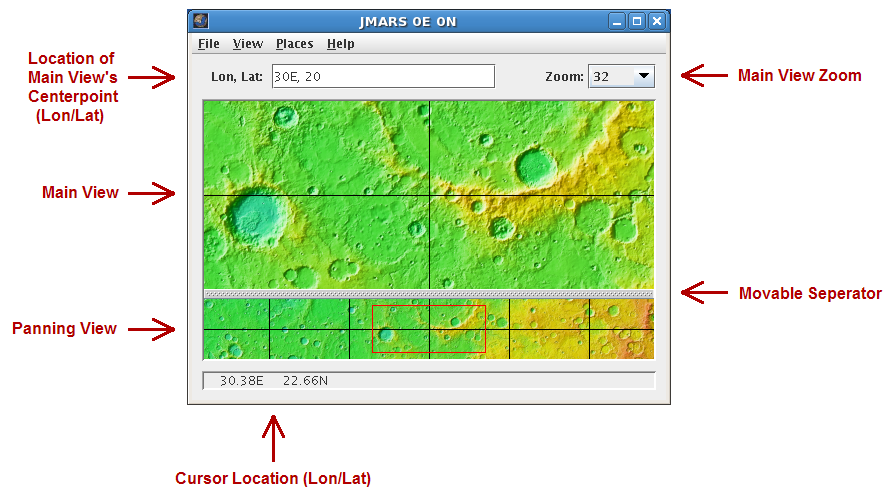
JMARS v.1.25
JMARS is an acronym that stands for Java Mission-planning and Analysis for Remote Sensing.
SmileLab v.3.3.1
SmileLab is an integrated working and production environment for viewing and analyzing numerical data of any sizes, and produce professional graphical documents.
Contour Plot v.1 1
Real contour plots are created in Excel. You can interact with the contour plot just like any other Excel plot. Contour Plot works with any contour data. It accommodates rectangular data, nearly rectangular data, and irregular data.
The LI Contour V+ Demonstration Copy v.7 2
The V option includes all capabilities of LI Contour, and adds the ability to calculate the volumetric difference between two surfaces. Output includes the total volumes of cut and fill, and a print out of the cut/fill amount at each data point.
Contour Plot for Excel v.1.01
Create real contour plots in Excel using any data (rectangular, nearly rectangular, or irregular data).